JustMap Foundation
Brand Identity, Information Design, Web Design, Data Analysis
JustMap Foundation (JMF) is a startup in Boston that started in late 2020. The Foundation uses rigorous analytics to give charitable donors new tools for identifying strategically important—yet underfunded and under-recognized—nonprofits and innovative initiatives working to achieve social justice goals.
JMF maps the complex interrelated elements of social justice challenges, enabling donors to visualize how individual nonprofit organizations fit into the broader nonprofit landscape.
My role as the Designer, was to draft and develop a brand identity for JMF and responsible for scoping long term design standards, brand identity, and visual maps. Other tasks include content development, copyediting, research, and analysis of raw data. I reported directly to the foundation’s Director and work closely with external developers to mange and amplify the foundation’s presence on the web.
On this page, you will find the current version of the social justice map, a draft brand guideline, and a draft website redesign.
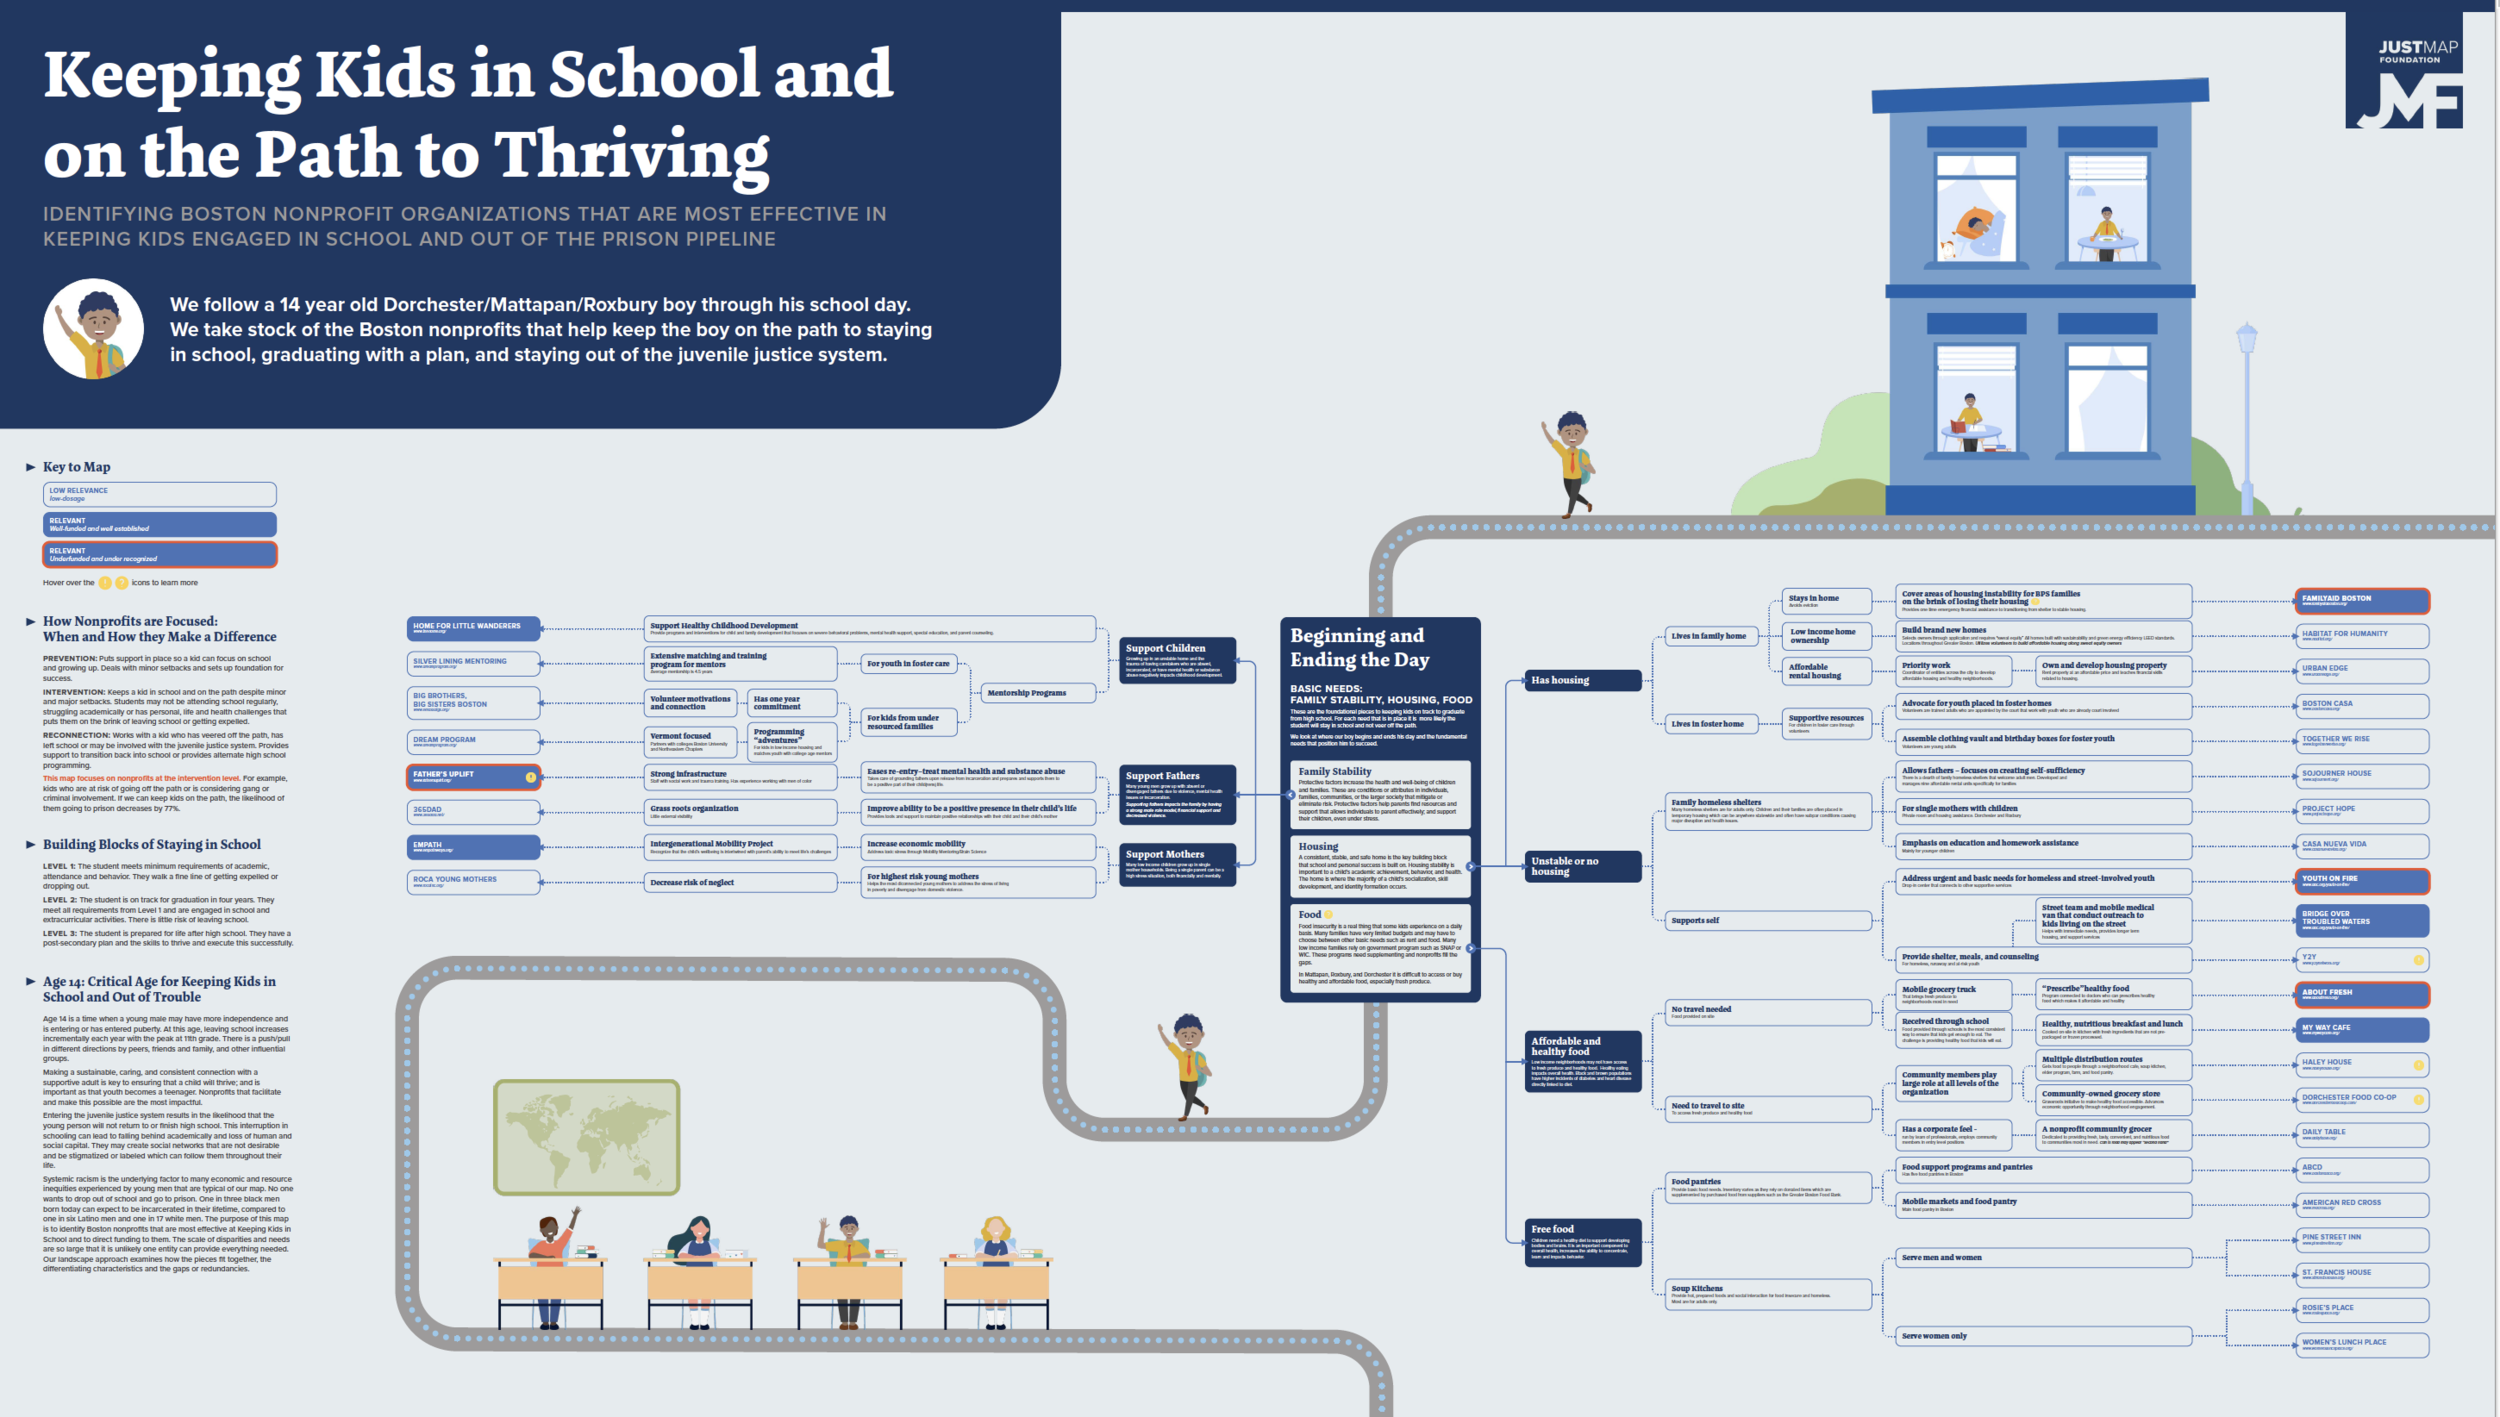
Keeping Kids in School and on the Path to Thriving
The goal of the interactive map is to identify Boston nonprofit organizations that are most effective in keeping kids engaged in school and out of the prison pipeline.
We follow a 14 year old Dorchester/Mattapan/Roxbury boy trying to make his way through the school day successfully. We illustrate what leads to trouble and focus on nonprofits at the intervention level.
Website Refresh
The direction of the Foundation is constantly changing and the team realizes we are quickly growing out of our current website. The current website was put together by a consultant “to have something up.” As we are starting to think through the site redesign and more thought into the overall branding; I put together a mockup of the possible redesign.
Brand Guidelines
JMF did not have a look and feel or any direction with creative infrastructure – the main priority was to analyze and visualize data. As I built out the map, I started adding assets that I was using to form a style guide.


